


: The Weight Loss Injection Revolution")


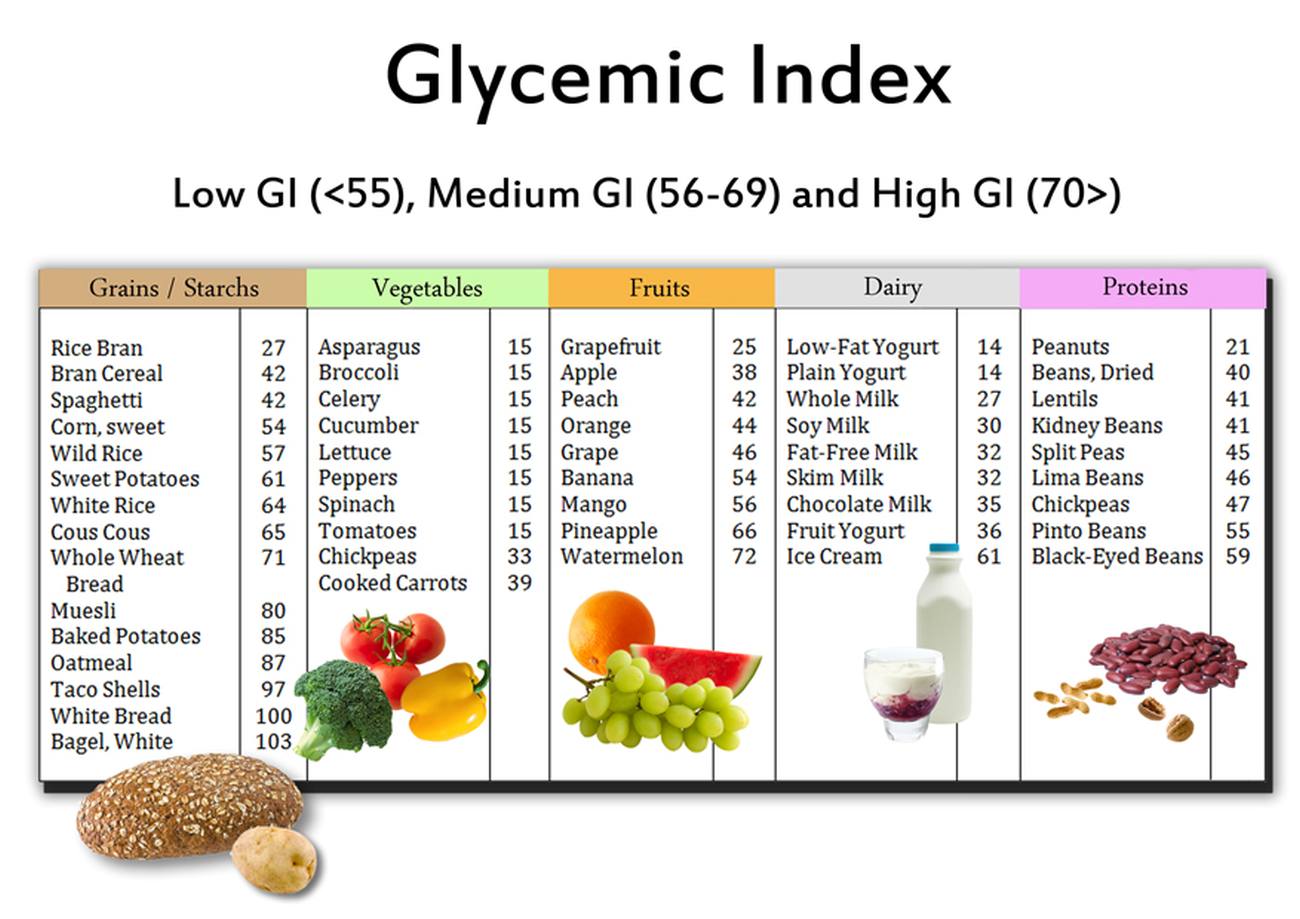
The Glycemic Index is the system used to rate how quickly a food raises your blood sugar level after being eaten.
As carbohydrates are digested they raise your blood sugar. The speed varies from one food to another. In general, foods can be categorized as either having high or low glycemic index. There is no “normal” glycemic index.
High and low Glycemic Index
Foods that raise your blood sugar quickly and to a greater degree are given a high glycemic Index number and those that release sugar into the blood stream slowly are given a low number.
For your quick reference please check the glycemic index chart below.
For example, pure cane sugar has the a glycemic index of 100. This is as high as it can be because it raises your blood sugar faster and higher than any other thing you could eat.
Every cell in your body needs energy to function and most get their energy from glucose.
Your body maintains a steady level of glucose in your blood so it is available whenever a cell needs it. When sugar levels are low, you become hungry and crave foods that have a high glycemic index because these foods raise your blood sugar quickly.
If your blood sugar is high, your body produces insulin which converts your blood sugar into fat. The problem occurs when you eat a food with a high glycemic index and your blood sugar quickly raises.
In response you produce insulin which turns the sugar into fat. Because the blood sugar was rising quickly, you over secret insulin to stop it and that causes your blood sugar to become too low. When that happens you crave foods with a high glycemic index because you intuitively know these will satisfy your need for sugar (craving).
Low GI Foods (55 or less)
- 100% stone-ground whole wheat or pumpernickel bread
- Oatmeal (rolled or steel-cut), oat bran, muesli
- Pasta, converted rice, barley, bulgar
- Sweet potato, corn, yam, lima/butter beans, peas, legumes and lentils
- Most fruits, non-starchy vegetables and carrots
Medium GI (56-69)
- Whole wheat, rye and pita bread
- Quick oats
- Brown, wild or basmati rice, couscous
High GI (70 or more)
- White bread or bagel
- Corn flakes, puffed rice, bran flakes, instant oatmeal
- Shortgrain white rice, rice pasta, macaroni and cheese from mix
- Russet potato, pumpkin
- Pretzels, rice cakes, popcorn, saltine crackers
- Melons and pineapple
What is a good Glycemic index number
Generally, the lower the Glycemic index of the food the better. As already explained foods with lower gylcemic index are less stressful for the body. See below glycemic index chart for more information.
Glycemic index – Glycemic Index Food List
| FOOD | Glycemic index (glucose = 100) | Serving size (grams) | Glycemic load per serving |
| BAKERY PRODUCTS AND BREADS | |||
| Banana cake, made with sugar | 47 | 60 | 14 |
| Banana cake, made without sugar | 55 | 60 | 12 |
| Sponge cake, plain | 46 | 63 | 17 |
| Vanilla cake made from packet mix with vanilla frosting (Betty Crocker) | 42 | 111 | 24 |
| Apple, made with sugar | 44 | 60 | 13 |
| Apple, made without sugar | 48 | 60 | 9 |
| Waffles, Aunt Jemima (Quaker Oats) | 76 | 35 | 10 |
| Bagel, white, frozen | 72 | 70 | 25 |
| Baguette, white, plain | 95 | 30 | 15 |
| Coarse barley bread, 75-80% kernels, average | 34 | 30 | 7 |
| Hamburger bun | 61 | 30 | 9 |
| Kaiser roll | 73 | 30 | 12 |
| Pumpernickel bread | 56 | 30 | 7 |
| 50% cracked wheat kernel bread | 58 | 30 | 12 |
| White wheat flour bread | 71 | 30 | 10 |
| Wonder™ bread, average | 73 | 30 | 10 |
| Whole wheat bread, average | 71 | 30 | 9 |
| 100% Whole Grain™ bread (Natural Ovens) | 51 | 30 | 7 |
| Pita bread, white | 68 | 30 | 10 |
| Corn tortilla | 52 | 50 | 12 |
| Wheat tortilla | 30 | 50 | 8 |
| BEVERAGES | |||
| Coca Cola®, average | 63 | 250 mL | 16 |
| Fanta®, orange soft drink | 68 | 250 mL | 23 |
| Lucozade®, original (sparkling glucose drink) | 95±10 | 250 mL | 40 |
| Apple juice, unsweetened, average | 44 | 250 mL | 30 |
| Cranberry juice cocktail (Ocean Spray®) | 68 | 250 mL | 24 |
| Gatorade | 78 | 250 mL | 12 |
| Orange juice, unsweetened | 50 | 250 mL | 12 |
| Tomato juice, canned | 38 | 250 mL | 4 |
| BREAKFAST CEREALS AND RELATED PRODUCTS | |||
| All-Bran™, average | 55 | 30 | 12 |
| Coco Pops™, average | 77 | 30 | 20 |
| Cornflakes™, average | 93 | 30 | 23 |
| Cream of Wheat™ (Nabisco) | 66 | 250 | 17 |
| Cream of Wheat™, Instant (Nabisco) | 74 | 250 | 22 |
| Grapenuts™, average | 75 | 30 | 16 |
| Muesli, average | 66 | 30 | 16 |
| Oatmeal, average | 55 | 250 | 13 |
| Instant oatmeal, average | 83 | 250 | 30 |
| Puffed wheat, average | 80 | 30 | 17 |
| Raisin Bran™ (Kellogg’s) | 61 | 30 | 12 |
| Special K™ (Kellogg’s) | 69 | 30 | 14 |
| GRAINS | |||
| Pearled barley, average | 28 | 150 | 12 |
| Sweet corn on the cob, average | 60 | 150 | 20 |
| Couscous, average | 65 | 150 | 9 |
| Quinoa | 53 | 150 | 13 |
| White rice, average | 89 | 150 | 43 |
| Quick cooking white basmati | 67 | 150 | 28 |
| Brown rice, average | 50 | 150 | 16 |
| Converted, white rice (Uncle Ben’s®) | 38 | 150 | 14 |
| Whole wheat kernels, average | 30 | 50 | 11 |
| Bulgur, average | 48 | 150 | 12 |
| COOKIES AND CRACKERS | |||
| Graham crackers | 74 | 25 | 14 |
| Vanilla wafers | 77 | 25 | 14 |
| Shortbread | 64 | 25 | 10 |
| Rice cakes, average | 82 | 25 | 17 |
| Rye crisps, average | 64 | 25 | 11 |
| Soda crackers | 74 | 25 | 12 |
| DAIRY PRODUCTS AND ALTERNATIVES | |||
| Ice cream, regular | 57 | 50 | 6 |
| Ice cream, premium | 38 | 50 | 3 |
| Milk, full fat | 41 | 250mL | 5 |
| Milk, skim | 32 | 250 mL | 4 |
| Reduced-fat yogurt with fruit, average | 33 | 200 | 11 |
| FRUITS | |||
| Apple, average | 39 | 120 | 6 |
| Banana, ripe | 62 | 120 | 16 |
| Dates, dried | 42 | 60 | 18 |
| Grapefruit | 25 | 120 | 3 |
| Grapes, average | 59 | 120 | 11 |
| Orange, average | 40 | 120 | 4 |
| Peach, average | 42 | 120 | 5 |
| Peach, canned in light syrup | 40 | 120 | 5 |
| Pear, average | 38 | 120 | 4 |
| Pear, canned in pear juice | 43 | 120 | 5 |
| Prunes, pitted | 29 | 60 | 10 |
| Raisins | 64 | 60 | 28 |
| Watermelon | 72 | 120 | 4 |
| BEANS AND NUTS | |||
| Baked beans, average | 40 | 150 | 6 |
| Blackeye peas, average | 33 | 150 | 10 |
| Black beans | 30 | 150 | 7 |
| Chickpeas, average | 10 | 150 | 3 |
| Chickpeas, canned in brine | 38 | 150 | 9 |
| Navy beans, average | 31 | 150 | 9 |
| Kidney beans, average | 29 | 150 | 7 |
| Lentils, average | 29 | 150 | 5 |
| Soy beans, average | 15 | 150 | 1 |
| Cashews, salted | 27 | 50 | 3 |
| Peanuts, average | 7 | 50 | 0 |
| PASTA and NOODLES | |||
| Fettucini, average | 32 | 180 | 15 |
| Macaroni, average | 47 | 180 | 23 |
| Macaroni and Cheese (Kraft) | 64 | 180 | 32 |
| Spaghetti, white, boiled, average | 46 | 180 | 22 |
| Spaghetti, white, boiled 20 min, average | 58 | 180 | 26 |
| Spaghetti, wholemeal, boiled, average | 42 | 180 | 17 |
| SNACK FOODS | |||
| Corn chips, plain, salted, average | 42 | 50 | 11 |
| Fruit Roll-Ups® | 99 | 30 | 24 |
| M & M’s®, peanut | 33 | 30 | 6 |
| Microwave popcorn, plain, average | 55 | 20 | 6 |
| Potato chips, average | 51 | 50 | 12 |
| Pretzels, oven-baked | 83 | 30 | 16 |
| Snickers Bar® | 51 | 60 | 18 |
| VEGETABLES | |||
| Green peas, average | 51 | 80 | 4 |
| Carrots, average | 35 | 80 | 2 |
| Parsnips | 52 | 80 | 4 |
| Baked russet potato, average | 111 | 150 | 33 |
| Boiled white potato, average | 82 | 150 | 21 |
| Instant mashed potato, average | 87 | 150 | 17 |
| Sweet potato, average | 70 | 150 | 22 |
| Yam, average | 54 | 150 | 20 |
| MISCELLANEOUS | |||
| Hummus (chickpea salad dip) | 6 | 30 | 0 |
| Chicken nuggets, frozen, reheated in microwave oven 5 min | 46 | 100 | 7 |
| Pizza, plain baked dough, served with parmesan cheese and tomato sauce | 80 | 100 | 22 |
| Pizza, Super Supreme (Pizza Hut) | 36 | 100 | 9 |
| Honey, average | 61 | 25 | 12 |
Sugar spikes
That spikes your sugar again and the cycle repeats itself. You go back and forth between high sugar with fat production, and low sugar with feelings of exhaustion, hunger, and cravings.
When you eat foods that have a high glycemic index you go back and forth between high and low blood sugar levels.
The cycle requires your pancreas to produce insulin and over time it becomes exhausted and your insulin becomes less effective. Your pancreas actually has to produce more insulin to get the same effect. This is the beginning of diabetes.
There are also studies that associate diets that contain foods with a high glycemic index to cancer, heart disease, eye conditions, and various other avoidable health issues.
")


A very informative article on the different aspects of diet. In fact, the information is so good that I have linked this article to my latest blog on Diet in Diabetes. This will certainly help my patients who are having diabetes as well as those who want to reduce weight.
Dear Sirs
I am so confued. How when out eating do I know exacly what I am eating and the quantity
I need an APP that can associate with what I am eating and advise accordingly